

” There has been no uncertainty with respect to the Micro Focus leadership’s commitment to building on the great brand and product we have developed at Vertica.”– Colin Mahony
I have interviewed Colin Mahony, SVP & General Manager, Vertica Product Group, Micro Focus.
In this interview we covered the recent spin-off of HPE software into a new combined Micro Focus company, and how this is affecting Vertica. We also covered the new release of Vertica 9, and the importance of Big Data analytics.
RVZ
Q1.With the recent spin-off of HPE software into a new, combined Micro Focus company, do you see things changing for Vertica?
Colin Mahony: From a product development, sales and customer support perspective – it’s been business as usual at Vertica leading up to and since the spin-merge with Micro Focus. Our focus, as always, is to build the best possible product and deliver world-class support for our growing customer base. That won’t change any time soon.
The biggest changes I see post spin-merge is that Vertica is now part of a pure-play software company, rather than a business where a majority of revenue comes from hardware. Running a software company is a lot different than running a hardware business. Under HPE, the software assets sometimes struggled in establishing their own identify as part of a much larger hardware business. Micro Focus on the other hand is designed from the ground up to build, sell and support software for our customers, that’s all we do. The new, combined Micro Focus is the 7th largest pure-play software company in the world, and we have the global scale to be an industry shaper.
But maybe even more exciting is the level of support and GTM independence that we are already seeing from Micro Focus in support of Vertica. You have likely seen Vertica’s logo and you’ll continue to see more of that, especially on the Vertica.com website that we launched in February and that already has almost 1 million page views! We have been structured uniquely in the new Micro Focus and this gives me complete confidence in our future. I’m genuinely excited about the opportunity to be in a business that is dedicated and focused purely on software – especially software with analytics built in, the new Micro Focus company mission – and the business value of that software for customers.
Q2. There are concerns that Micro Focus may end up managing mature software assets of HPE and extending their shelf life, rather than actively investing in feature developments. What is your take on this?
Colin Mahony: I fundamentally disagree with that. Micro Focus helps companies bridge their existing technologies with new infrastructure and applications. It helps them maximize their ROI while embracing innovation to address the opportunities of the new Hybrid IT and analytics-driven environment. It’s frankly wrong to expect customers to make investments in core technologies without working hard to maximize the investment in those technologies. Over the years, Micro Focus has taken core assets and made them modern, delivering significant value to the company and our customers.
It’s also important to note that the new, combined Micro Focus has an incredible depth and breadth of software assets in its portfolio – covering DevOps, IT Operations, Cloud, Security, Big Data and more – not all of which are mature products.
Take SUSE for instance, a Micro Focus product and the fastest growing open Linux platform. I’m very impressed with the approach that Micro Focus has on supporting growth businesses like this. I have the very same expectations for our Vertica business, especially because this is a massive new opportunity for Micro Focus, which prior to the spin-merge did not have a Big Data offering.
This means no confusion, no duplication of resources, and a lot of potential because we know that every company in virtually every industry is thinking about how to leverage analytics at the core of everything they do, and again, why “analytics built in” is at the core of the new company’s mission.
Q3. Will Micro Focus continue to develop Vertica?
Colin Mahony: There has been no uncertainty with respect to the Micro Focus leadership’s commitment to building on the great brand and product we have developed at Vertica. Since the spin-merge with Micro Focus was first announced in 2016, we have actually been reinvigorating the Vertica brand name, all based on the recognition that Micro Focus has a tremendous market opportunity in front of it with the advent of Big Data and the growing importance all companies are placing on the value of analytics. You can see this commitment with the build-out of our new website, www.vertica.com, our presence at industry trade shows and conferences, and more.
In a recent interview, Chris Hsu, CEO of the new, combined Micro Focus, expressed his commitment to big data analytics – and specifically Vertica – as the number one area he is most excited to focus on and grow within the portfolio. It’s an exciting time to be part of Vertica. We have an incredible opportunity in front of us.
Q4. Micro Focus now has a number of software assets covering Hybrid IT, DevOps, Security and more, where analytics is critical. Does or will Vertica play a role in those products?
Colin Mahony: Absolutely. Not only is there a strong commitment in continuing to develop Vertica as a product and brand, there’s wide recognition within Micro Focus that predictive analytics is critical for the success of data-centric enterprises, and therefore a critical component to the breadth of assets in our own portfolio.
Vertica is an ideal solution for embedded analytics. Businesses that embed Vertica stand out from the competition and deliver higher value to customers. Specifically designed for analytic workloads, Vertica’s speed and performance, advanced analytics, ease of deployment, and support for data scientists make it tailor-made for embedding. We now have an opportunity to embed these great analytical features in a range of Micro Focus software assets, something we’ve already begun to do in application delivery management, IT operations and security. As I’ve said, a core part of our company’s core mission moving forward is to provide customers with enterprise-grade scalable software with analytics built in. I see this as a large and growing opportunity for innovation here at Micro Focus.
Q5. You recently released Vertica Version 9, with major enhancements in cloud deployments and separation of compute and storage. Are these common themes for Vertica moving forward?
Colin Mahony: They are. Vertica has always been 100% committed to helping our customers deploy advanced analytics free from underlying infrastructure and hardware lock-in. We’ve seen that legacy data warehouse solutions have forced many enterprises into rigid and high-cost proprietary hardware and analytics solutions supporting only limited data formats and deployment options. As data formats and storage locations continuously evolve, organizations require a powerful and unified solution to analyze data in the right place at the right time, with the performance and economics that the business requires. Our continued commitment to this principle – and our support for any major cloud platform, whether AWS, Azure or GCP – is foundational to Vertica’s core.
Separation of compute and storage is a logical extension of this product development ethos. Vertica’s beta release of its new Eon Mode architecture, offering separation of compute and storage, provides rapid elastic scaling up and down of the Vertica cluster, with just-in-time workload-based provisioning.
An intelligent, new caching mechanism on the nodes enable organizations to benefit from Vertica’s industry-leading query performance. Companies in the AWS ecosystem will be able to leverage AWS S3 for storage and Vertica’s query-optimized analytics engine for processing speed to capitalize on cloud economics.
You can expect continued product development and investment in these areas.
Q6. With the explosion of data lakes and other external data storage (including Hadoop, AWS S3, etc.), does this complicate the analytical database market or change the dynamics of how and where you analyze data?
Colin Mahony: It certainly changes the big data landscape. Hadoop has been a boon to companies and organizations that want to store vast new volumes of unstructured data cheaply in the form of a data lake. AWS S3 has extended that cheap storage to the cloud. Although Hadoop stores massive volumes of unstructured data, performing analytics on Hadoop proved challenging. Despite this challenge, companies did not want to move large amounts of data in and out of their Hadoop data lakes. As a result, more and more companies were looking to build out enterprise-grade SQL analytics on top of their Hadoop investments. This created a tremendous opportunity for Vertica, and Vertica for SQL on Hadoop was born. Vertica SQL on Hadoop is the same binary, the same core engine, with the ability to deploy natively on Hadoop nodes. Since then, we’ve continued to innovate on how Vertica integrates with the various Hadoop distributions and file formats. We’ve leveraged our years of experience in the Big Data analytics marketplace to enable organizations to analyze their data not only in place, but in the right place – without data movement – while supporting any major cloud deployment for fast and reliable read and write for multiple data formats.
Starting with the release of Vertica 8, users could derive more value from their Hadoop data lakes with Vertica’s high-performance Parquet and ORC Readers that enable users to securely access and analyze data that resides in Hadoop data lakes without copying or moving the data. And now with our latest Vertica 9 release, we’ve introduced a new HDFS Parquet writer – built on Vertica’s fast and reliable ability to not only read, but now write data and results on HDFS – to derive and contribute immediate insights on growing data lakes. Organizations can use Vertica 9’s flexible and expanded deployment options across on-premise, private, and public clouds, and on Hadoop and AWS S3 data lakes, to adopt a best-fit analytical solution.
The days of having to move data in and out of various databases and data lakes is coming to an end. In the future, more and more companies will bring analytics to the data, analyzing it in place. We believe Vertica is working at the forefront of this market transformation.
Q7. Over the last few releases, Vertica has made significant advancements in the area of in-database machine learning. How do you see this set of capabilities contributing to Vertica’s strategy and the success of your customers?
Colin Mahony: There’s no doubt that machine learning and predictive analytics are, and will continue to be a core differentiator for organizations. In today’s data-driven world, creating a competitive advantage depends on your ability to transform massive volumes of data into meaningful insights. Vertica has always supported the world’s leading data-driven organizations with the fastest SQL and extended SQL analytics. And now, by building machine learning functions directly into Vertica’s core — with no need to download and install separate packages — we are transforming the way data scientists and analysts across industries interact with data; removing barriers and accelerating time to value on predictive analytics projects. And it’s not just about developing the right algorithms and models. Our goal at Vertica is to support the entire machine learning and predictive analytics process, from data preparation to model evaluation and deployment – all using Vertica’s industry-leading scalability and performance. I’m incredibly excited to see these features transform data science and predictive analytics projects within our customer base, and for this reason, in-database machine learning will play a major role in Vertica’s future, and the future of our customers.
Our commitment to this area can be seen in the latest Vertica 9 release, which provides a comprehensive set of new Machine Learning algorithms for categorization, overfitting and prediction to enhance processing speed by eliminating the need for down-sampling and data movement. There’s also support for new data-preparation functions for deriving greater meaning from the data, while improving the quality of analysis, and a streamlined end-to-end workflow that simplifies production deployment of Machine models – particularly for customers that embed Vertica and require the ability to replicate models across clusters.
————————

Colin Mahony, SVP & General Manager, Vertica Product Group, Micro Focus
Colin Mahony leads the Vertica Product Group for Micro Focus, helping the world’s most data driven organizations to leverage and monetize their business data. Vertica was founded in 2005 and is one of the industry’s fastest growing, advanced analytics platform with in database machine learning, the ability to analyze data in the right place, and freedom from underlying infrastructure. Micro Focus also leverages Vertica to deliver embedded analytics across a very broad portfolio of enterprise grade software.
In 2011, Colin joined Hewlett Packard as part of the highly successful acquisition of Vertica, and took on the responsibility of VP and General Manager for HP Vertica, where he guided the business to remarkable annual growth and recognized industry leadership. Colin brings a unique combination of technical knowledge, market intelligence, customer relationships, and strategic partnerships to one of the fastest growing and most exciting segments of HP Software.
Prior to Vertica, Colin was a Vice President at Bessemer Venture Partners focused on investments primarily in enterprise software, telecommunications, and digital media. He established a great network and reputation for assisting in the creation and ongoing operations of companies through his knowledge of technology, markets and general management in both small startups and larger companies. Prior to Bessemer, Colin worked at Lazard Technology Partners in a similar investor capacity.
Prior to his venture capital experience, Colin was a Senior Analyst at the Yankee Group serving as an industry analyst and consultant covering databases, BI, middleware, application servers and ERP systems. Colin helped build the ERP and Internet Computing Strategies practice at Yankee in the late nineties.
Colin earned an M.B.A. from Harvard Business School and a bachelor’s degrees in Economics with a minor in Computer Science from Georgetown University. He is an active volunteer with Big Brothers Big Sisters of Massachusetts Bay and the Joey Fund for Cystic Fibrosis as well as a mentor and board member of Year Up Boston.
————–
Resources
– What’s New in Vertica 9.0?, ODBMS.org, 22 Oct, 2017
– What’s New in Vertica 9.0: Eon Mode Beta, ODBMS.org, 22 Oct, 2017
– Vertica Version 9.0, ODBMS.org, 22 Oct, 2017
– Micro Focus Introduces Vertica 9, ODBMS.org, Sept. 27, 2017
Follow us on Twitter: @odbmsorg
##
“With multi scale dataflow computing, we adjust the structure of the computer to the problem, rather than spending countless hours molding the problem into a computer language which is then interpreted by a microprocessor in an endless game of “Chinese whispers”. The poor microprocessor has no chance to figure out what the original problem might have been. We take a specific problem and program your computer to only solve that problem, or teach you to do it yourself. This means that the microprocessor does not waste energy, time and power on trying to figure out what needs to be computed next.”–Devin Graham.
I have interviewed Devin Graham, in charge of Finance Risk Products at Maxeler Technologies. We covered in the interview the challenges and opportunities for risk managers and how dataflow technology is transforming the industry.
RVZ
Q1. What are the typical functions of a chief risk officer?
Devin Graham: To minimize risk across four categories; market risk, operational risk, credit risk and regulatory risk. For market risk you are trying to maximize the potential profit of your institution whilst ensuring you have the lowest amount of volatile risk. With operational risk you need to look at your business processes and ensure you have systems and controls in place that minimise any negative financial impacts to running your business. To manage credit risk you need to minimise the risk of the exposure of your assets and profits to your counterparties. Regulatory risk management involves ensuring the business is aware of and follows regulations.
Q2. What are the main challenges at present for financial risk management?
Devin Graham: The data sets you are dealing with now are very large. The challenge today is meeting the complexity and vastness of this data with speed – in real time. The velocity of data also poses challenges around security, particularly with threats of intrusion and spoofing attacks which are much harder to detect when there is so much data to analyse. Your computer needs to work out the patterns of serial spoofers, and CPUs with standard software stacks are overwhelmed by the challenge.
Q3. In which way can data flow technology be useful for risk management for the finance industry?
Devin Graham: Our dataflow technology provides complex calculations at maximum speed, for running analytics on large scale data sets and for line rate processing of trade flow and matching, as well as data enrichment. Multiscale Dataflow provides the technology to bridge over today’s financial capability gap, providing real and measurable competitive advantage.
Q4. What exactly is dataflow computing?
Devin Graham: With multiscale dataflow computing, we adjust the structure of the computer to the problem, rather than spending countless hours molding the problem into a computer language which is then interpreted by a microprocessor in an endless game of “Chinese whispers”.
The poor microprocessor has no chance to figure out what the original problem might have been. We take a specific problem and program your computer to only solve that problem, or teach you to do it yourself. This means that the microprocessor does not waste energy, time and power on trying to figure out what needs to be computed next.
In a financial context, multiscale dataflow makes it possible to analyse risk in real time, rather than off-line, looking at risk in the future, rather than computing the risk of the past.
Q5. What are the main differences in performing dataflow computation, from computing with conventional CPUS?
Devin Graham: The main difference is that dataflow provides computational power at much lower energy consumption, much higher performance density and greater speed at tremendous savings in total cost of ownership. It is ideal for dealing with Big Complex Data.
More technically, CPUs solve equations linearly – through time. Dataflow computes vast numbers of equations as a graph, with data flowing through the nodes all at the same time. Complex calculations happen as a side effect of the data flowing through a graph which looks like the structure of your problem.
Q6. Do you have any measures to share with us on the benefits in performance, space and power consumption?
Devin Graham: Maxeler’s Dataflow technology enables organisations to speed up processing times by 20-50x when comparing computing boxes of the same size, with over 90% reduction in energy usage and over 95% reduction in data center space. Taking one of our customers as an example. They were able to run computations of 50 compute nodes, in a single dataflow node. Such ability brings 32 Maxeler dataflow nodes to an equivalent of 1,600 CPU nodes, delivering operational cost saving of £3.2 million over 3 years.
In a financial risk context the advantages of Multiscale Dataflow Computing enable the analysis of thousands of market scenarios in minutes rather than hours. A Tier 1 investment bank recently delivered portfolio pricing and risk in seconds, down from minutes.
Q7. What is the new paradigm for financial risk management defined by Maxeler Technologies?
Devin Graham: The new paradigm shift resulting from Maxeler’s technology enables traders and risk managers with a super power: real-time data analysis. The technology is available right here and right now, as opposed to other technologies which remain on the horizon, or require a datacenter to be cooled down to 0 Kelvin to compute a few bits of results.
Dataflow computing works at room temperature, without the need to cool things down to the point where even the smallest particles stop moving.
Since we describe Dataflow programs in Java, it is easy to learn how to program Dataflow Engines (DFEs). Financial analytics experts are learning how to program their DFEs themselves — putting power back into the hands of financial experts, without the need for help from external sources. That is very exciting!
—————
Devin Graham, Senior Risk Advisor, Maxeler Technologies
Devin Graham, former partner and Chief Risk Officer at a multi-billion dollar hedge fund has spent his entire career in the financial services industry, managing risk, technology and businesses for large hedge funds and leading investment banks.
As Chief Risk Officer, Devin established and chaired the risk committee, was a member of the executive committee and investor relations management team. During his tenure, the fund achieved market leading returns with minimal return volatility.
Previously, Devin developed and managed multiple new technology driven businesses at a leading investment bank including Prime Brokerage, Derivative Investor Products, and Risk Analytics.
Devin received his B.S. in Biomechanical Engineering from MIT
Resources
– Maxeler Technologies to provide supercomputer performance to UK Government on the G-Cloud
Related Posts
Follow us on Twitter: @odbmsorg
##
“To be competitive with non-open-source cloud deployment options, open source databases need to invest in “ease-of-use.” There is no tolerance for complexity in many development teams as we move to “ops-less” deployment models.” –Peter Zaitsev
I have interviewed Peter Zaitsev, Co-Founder and CEO of Percona.
In this interview, Peter talks about the Open Source Databases market; the Cloud; the scalability challenges at Facebook; compares MySQL, MariaDB, and MongoDB; and presents Percona’s contribution to the MySQL and MongoDB ecosystems.
RVZ
Q1. What are the main technical challenges in obtaining application scaling?
Peter Zaitsev: When it comes to scaling, there are different types. There is a Facebook/Google/Alibaba/Amazon scale: these giants are pushing boundaries, and usually are solving very complicated engineering problems at a scale where solutions aren’t easy or known. This often means finding edge cases that break things like hardware, operating system kernels and the database. As such, these companies not only need to build a very large-scale infrastructures, with a high level of automation, but also ensure it is robust enough to handle these kinds of issues with limited user impact. A great deal of hardware and software deployment practices must to be in place for such installations.
While these “extreme-scale” applications are very interesting and get a lot of publicity at tech events and in tech publications, this is a very small portion of all the scenarios out there. The vast majority of applications are running at the medium to high scale, where implementing best practices gets you the scalability you need.
When it comes to MySQL, perhaps the most important question is when you need to “shard.” Sharding — while used by every application at extreme scale — isn’t a simple “out-of-the-box” feature in MySQL. It often requires a lot of engineering effort to correctly implement it.
While sharding is sometimes required, you should really examine whether it is necessary for your application. A single MySQL instance can easily handle hundreds of thousands per second (or more) of moderately complicated queries, and Terabytes of data. Pair that with MemcacheD or Redis caching, MySQL Replication or more advanced solutions such as Percona XtraDB Cluster or Amazon Aurora, and you can cover the transactional (operational) database needs for applications of a very significant scale.
Besides making such high-level architecture choices, you of course need to also ensure that you exercise basic database hygiene. Ensure that you’re using the correct hardware (or cloud instance type), the right MySQL and operating system version and configuration, have a well-designed schema and good indexes. You also want to ensure good capacity planning, so that when you want to take your system to the next scale and begin to thoroughly look at it you’re not caught by surprise.
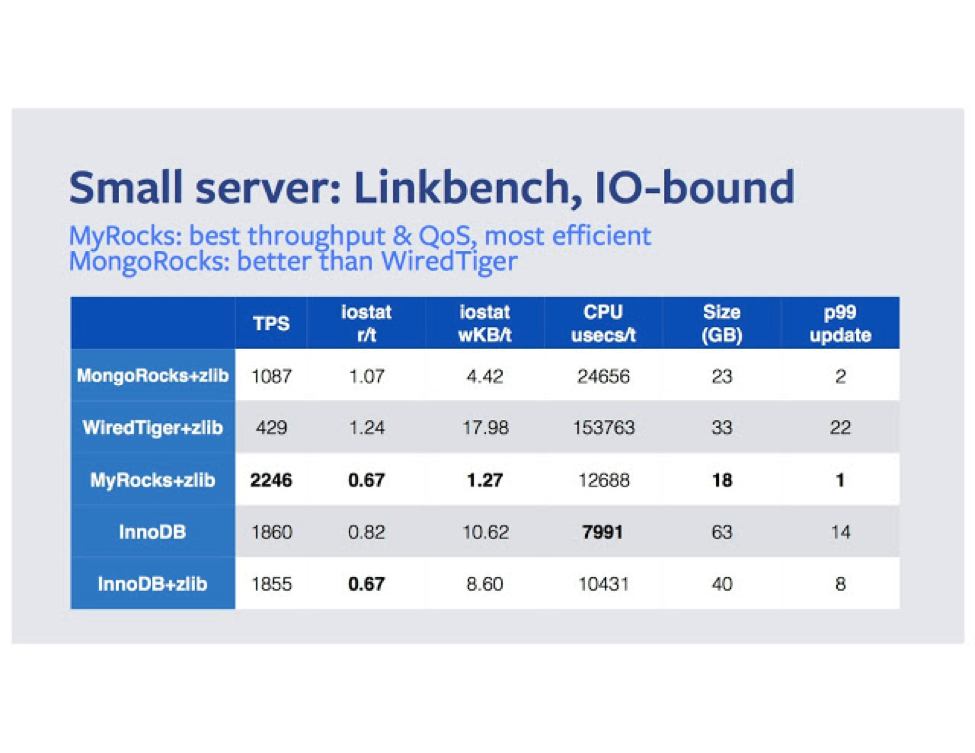
Q2. Why did Facebook create MyRocks, a new flash-optimized transactional storage engine on top of RocksDB storage engine for MySQL?
Peter Zaitsev: The Facebook Team is the most qualified to answer this question. However, I imagine that at Facebook scale being efficient is very important because it helps to drive the costs down. If your hot data is in the cache when it is important, your database is efficient at handling writes — thus you want a “write-optimized engine.”
If you use Flash storage, you also care about two things:
- – A high level of compression since Flash storage is much more expensive than spinning disk.
– You are also interested in writing as little to the storage as possible, as the more you write the faster it wears out (and needs to be replaced).
RocksDB and MyRocks are able to achieve all of these goals. As an LSM-based storage engine, writes (especially Inserts) are very fast — even for giant data sizes. They’re also much better suited for achieving high levels of compression than InnoDB.
This Blog Post by Mark Callaghan has many interesting details, including this table which shows MyRocks having better performance, write amplification and compression for Facebook’s workload than InnoDB.
Q3. Beringei is Facebook’s open source, in-memory time series database. According to Facebook, large-scale monitoring systems cannot handle large-scale analysis in real time because the query performance is too slow. What is your take on this?
Peter Zaitsev: Facebook operates at extreme scale, so it is no surprise the conventional systems don’t scale well enough or aren’t efficient enough for Facebook’s needs.
I’m very excited Facebook has released Beringei as open source. Beringei itself is a relatively low-end storage engine that is hard to use for a majority of users, but I hope it gets integrated with other open source projects and provides a full-blown high-performance monitoring solution. Integrating it with Prometheus would be a great fit for solutions with extreme data ingestion rates and very high metric cardinality.
Q4. How do you see the market for open source databases evolving?
Peter Zaitsev: The last decade has seen a lot of open source database engines built, offering a lot of different data models, persistence options, high availability options, etc. Some of them were build as open source from scratch, while others were released as open source after years of being proprietary engines — with the most recent example being CMDB2 by Bloomberg. I think this heavy competition is great for pushing innovation forward, and is very exciting! For example, I think if that if MongoDB hadn’t shown how many developers love a document-oriented data model, we might never of seen MySQL Document Store in the MySQL ecosystem.
With all this variety, I think there will be a lot of consolidation and only a small fraction of these new technologies really getting wide adoption. Many will either have niche deployments, or will be an idea breeding ground that gets incorporated into more popular database technologies.
I do not think SQL will “die” anytime soon, even though it is many decades old. But I also don’t think we will see it being the dominant “database” language, as it has been since the turn of millennia.
The interesting disruptive force for open source technologies is the cloud. It will be very interesting for me to see how things evolve. With pay-for-use models of the cloud, the “free” (as in beer) part of open source does not apply in the same way. This reduces incentives to move to open source databases.
To be competitive with non-open-source cloud deployment options, open source databases need to invest in “ease-of-use.” There is no tolerance for complexity in many development teams as we move to “ops-less” deployment models.
Q5. In your opinion what are the pros and cons of MySQL vs. MariaDB?
Peter Zaitsev: While tracing it roots to MySQL, MariaDB is quickly becoming a very different database.
It implements some features MySQL doesn’t, but also leaves out others (MySQL Document Store and Group Replication) or implements them in a different way (JSON support and Replication GTIDs).
From the MySQL side, we have Oracle’s financial backing and engineering. You might dislike Oracle, but I think you agree they know a thing or two about database engineering. MySQL is also far more popular, and as such more battle-tested than MariaDB.
MySQL is developed by a single company (Oracle) and does not have as many external contributors compared to MariaDB — which has its own pluses and minuses.
MySQL is “open core,” meaning some components are available only in the proprietary version, such as Enterprise Authentication, Enterprise Scalability, and others. Alternatives for a number of these features are available in Percona Server for MySQL though (which is completely open source). MariaDB Server itself is completely open source, through there are other components that aren’t that you might need to build a full solution — namely MaxScale.
Another thing MariaDB has going for it is that it is included in a number of Linux distributions. Many new users will be getting their first “MySQL” experience with MariaDB.
For additional insight into MariaDB, MySQL and Percona Server for MySQL, you can check out this recent article
Q6. What’s new in the MySQL and MongoDB ecosystem?
Peter Zaitsev: This could be its own and rather large article! With MySQL, we’re very excited to see what is coming in MySQL 8. There should be a lot of great changes in pretty much every area, ranging from the optimizer to retiring a lot of architectural debt (some of it 20 years old). MySQL Group Replication and MySQL InnoDB Cluster, while still early in their maturity, are very interesting products.
For MongoDB we’re very excited about MongoDB 3.4, which has been taking steps to be a more enterprise ready database with features like collation support and high-performance sharding. A number of these features are only available in the Enterprise version of MongoDB, such as external authentication, auditing and log redaction. This is where Percona Server for MongoDB 3.4 comes in handy, by providing open source alternatives for the most valuable Enterprise-only features.
For both MySQL and MongoDB, we’re very excited about RocksDB-based storage engines. MyRocks and MongoRocks both offer outstanding performance and efficiency for certain workloads.
Q7. Anything else you wish to add?
Peter Zaitsev: I would like to use this opportunity to highlight Percona’s contribution to the MySQL and MongoDB ecosystems by mentioning two of our open source products that I’m very excited about.
First, Percona XtraDB Cluster 5.7.
While this has been around for about a year, we just completed a major performance improvement effort that allowed us to increase performance up to 10x. I’m not talking about improving some very exotic workloads: these performance improvements are achieved in very typical high-concurrency environments!
I’m also very excited about our Percona Monitoring and Management product, which is unique in being the only fully packaged open source monitoring solution specifically built for MySQL and MongoDB. It is a newer product that has been available for less than a year, but we’re seeing great momentum in adoption in the community. We are focusing many of our resources to improving it and making it more effective.
———————
Peter Zaitsev co-founded Percona and assumed the role of CEO in 2006. As one of the foremost experts on MySQL strategy and optimization, Peter leveraged both his technical vision and entrepreneurial skills to grow Percona from a two-person shop to one of the most respected open source companies in the business. With more than 150 professionals in 29 countries, Peter’s venture now serves over 3000 customers – including the “who’s who” of Internet giants, large enterprises and many exciting startups. Percona was named to the Inc. 5000 in 2013, 2014, 2015 and 2016.
Peter was an early employee at MySQL AB, eventually leading the company’s High Performance Group. A serial entrepreneur, Peter co-founded his first startup while attending Moscow State University where he majored in Computer Science. Peter is a co-author of High Performance MySQL: Optimization, Backups, and Replication, one of the most popular books on MySQL performance. Peter frequently speaks as an expert lecturer at MySQL and related conferences, and regularly posts on the Percona Data Performance Blog. He has also been tapped as a contributor to Fortune and DZone, and his recent ebook Practical MySQL Performance Optimization Volume 1 is one of percona.com’s most popular downloads.
————————-
Resources
– MySQL vs MongoDB – When to Use Which Technology. Peter Zaitsev, June 22, 2017
– Percona Live Open Source Database Conference Europe, Dublin, Ireland. September 25 – 27, 2017
Related Posts
follow us on Twitter: @odbmsorg
##
“Gaia continues to be a challenging mission in all areas even after 4 years of operation.
In total we have processed almost 800 Billion (=800,000 Million) astrometric, 160 Billion (=160,000 Million) photometric and more than 15 Billion spectroscopic observation which is the largest astronomical dataset from a science space mission until the present day.”
— Uwe Lammers.
In December of 2013, the European Space Agency (ESA) launched a satellite called Gaia on a five-year mission to map the galaxy and learn about its past. The Gaia mission is considered by the experts “the biggest data processing challenge to date in astronomy”.
I recall here the Objectives of the Gaia Project (source ESA Web site):
“To create the largest and most precise three dimensional chart of our Galaxy by providing unprecedented positional and radial velocity measurements for about one billion stars in our Galaxy and throughout the Local Group.”
I have been following the GAIA mission since 2011, and I have reported it in three interviews until now.
In this interview, Uwe Lammers – Gaia’s Science Operations Manager – gives a very detailed description of the data challenges and the opportunities of the Gaia mission.
This interview is the fourth of the series, the second after the launch.
Enjoy!
RVZ
Q1. Of the raw astrometry, photometry and spectroscopy data collected so far by the Gaia spacecraft, what is their Volume, Velocity, Variety, Veracity and Value?
Since the beginning of the nominal mission in 2014 until end June 2017 the satellite has delivered about 47.5 TB compressed raw data. This data is not suitable for any scientific analysis but first has to be processed into higher-level products which inflates the volume about 4 times.
The average raw daily data rate is about 40 GB but highly variable depending on which part of the sky the satellite is currently scanning through. The data is highly-complex and interdependent but not unstructured – it does not come with a lot of meta-information as such but follows strictly defined structures. In general it is very trustworthy, however, the downstream
data processing cannot blindly assume that every single observation is valid.
As with all scientific measurements, there can be outliers which must be identified and eliminated from the data stream as part of the analysis. Regarding value, Gaia’s data set is absolutely unique in a number of ways.
Gaia is the only mission surveying the complete sky with unprecedented precision and completeness. The end results is expected to be a treasure trove for generations of astronomers to come.
Q2 How is this data transmitted to Earth?
Under normal observing conditions the data is transmitted from the satellite to the ground through a so-called phased-array-antenna (PAA) at a rate of up to 8.5 Mbps. As the satellite spins, it continuously keeps a radio beam directed towards the Earth by activating successive panels on the PAA. This is a fully electronic process as there can be no moving parts on Gaia which would otherwise disturb the precise measurements. On the Earth we use three 35m radio dishes in Spain, Australia, and Argentina to receive the telemetry from Gaia.
Q3. Calibrated processed data, high level data products and raw data. What is the difference? What kind of technical data challenges do they each pose?
That question is not easy to answer in a few words. Raw data are essentially unprocessed digital measurements from the CCDs – perhaps comparable to data from the “raw mode” of digital consumer cameras. They have to be processed with a range of complex software to turn it into higher level products from which at the end astrophysical information can be inferred. There are many technical challenges, the most basic one is still to handle the 100s of GBs of daily data. Handling means, reception, storage, processing, I/O by the scientific algorithms, backing-up, and disseminating the processed data to 5 other partner data processing centres across Europe.
Here at the Science Operations Centre (SOC) near Madrid we have chosen years ago InterSystems Caché RDMS + NetApp hardware as our storage solution and this continues to be a good solution. The system is reliable and performant which are crucial pre-requisites for us. Another technical challenge is data accountability which means to keep track of the more than 70 Mio scientific observation we get from the satellite every single day.
Q4. Who are the users for such data and what they do with it?
The data we are generating here at the SOC has no immediate users. It is sent out to the 5 other Gaia Data Processing Centres where more scientific processing takes place and more higher-level products get created. From all this processed data we are constructing a stellar catalogue which is our final result and this is what the end users – the astronomical community of world – to see. The first version of our catalogue was published 14 September last year (Gaia Data Release 1) and we are currently working hard to release the second version (DR2) in April next year.
Our end users do fundamental astronomical research with the data ranging from looking at individual stars, studies of clusters, dynamics of our Milky-Way to cosmological questions like the expansion rate of our universe. The scientific exploitation of the Gaia data has just started but already now more than 200 scientific articles have been published. This is about 1 per day since DR1 and we expect this rate to go higher up after DR2.
Q5. Can you explain at a high level how is the ground processing of Gaia data implemented?
ESA has entrusted the Gaia data processing to the Data Processing Analysis Consortium (DPAC) which the SOC is an integral part of. DPAC consists of 9 so-called Coordination Units (CU) and 6 data processing centres (DPCs) across Europe, so this is a large distributed system.
In total some 450 people from 20+ countries with a large range of educational backgrounds and experiences are forming DPAC. Roughly speaking, the CUs are responsible for writing and validating the scientific processing software which is then run in one of the DPCs (every CU is associated with exactly one DPC).
The different CUs cover different aspects of the data processing (e.g. CU3 takes care of astrometry, CU5 of photometry).
The corresponding processes run more or less independent of each other, however, due to the complex interdependencies of the Gaia data itself this is only a first approximation. Ultimately, everything depends on everything else (e.g. astrometry depends on photometry and vice versa) which means that the entire system has to be iterated to produce the final solution. As you can imagine a lot of data has the be exchanged. SOC/DPCE is the hub in a hub-and-spokes topology where the other 5 DPCs are sitting at the ends of the spokes. No data exchange between DPCs is allowed but all the data flow is centrally managed through the hub at DPCE.
Q6. How do you process the data stream in near real-time in order to provide rapid alerts to facilitate ground-base follow up?
Yes, indeed we do. For ground-based follow up observations of variable objects quick turn-around times are essential. The time difference between an observation made on-board and the confirmation of a photometric alert on the ground is typically 2 days now which is close to the optimal value given all the operational constraints we have.
Q7. What are the main technical challenges with respect to data processing, manipulation and storage you have encountered so far? and how did you solved them?
Regarding storage, the handling of 100s of GBs of raw and processed data every day has always been and remains until today quite a challenge as explained above. The Gaia data reduction task is also a formidable computational problem. Years ago we estimated the total numerical effort to produce the final catalogue at some 10^20 FLOPs and this has proven fairly accurate.
So we need quite some number-crunching capabilities in the DPCs and to continuously expand CPU resources as the data volume keeps growing in the operational phase of the mission. Moore’s law is slowly coming to an end but, fortunately, a number of algorithms are perfectly parallelizable (processing every object in the sky individually and isolated) such that CPU bottlenecks can be ameliorated by simply adding more processors to the existing systems.
Data transfers are likewise a challenge. At the moment 1 Gbps connections (public Internet) between DPCE and the other 5 DPCs are sufficient, however, in the coming years we heavily rely on seeing bandwidths increasing to 10 Gbps and beyond. Unfortunately, this is largely not under our control which is a risk to the project.
Q8. What kind of databases and analytics tools do you use for the Gaia`s data pipeline?
As explained above, for the so-called daily pipeline we have chosen InterSystems Caché and are very satisfied with this approach. We had some initial problems with the system but were able to overcome all difficulties with the help of Intersystems. We much appreciated their excellent service and customer orientation in this phase and till the present day. Regarding analytics tools we use most facilities that are part of Caché, but have also developed a suite of custom-made solutions.
Q9. How do you transform the raw information into useful and reliable stellar positions?
The raw data from the satellite is first turned into higher level-products which already includes preliminary estimates for the stellar positions. But each of these positions is then only based on a single measurements. The high accuracy of Gaia comes from combining _all_ observations that have been taken during the mission with a scheme called Astrometric Iterative Solution (AGIS) [see The astrometric core solution for the Gaia mission. Overview of models, algorithms, and software implementation].
This cannot be done on a star-by-star basis but is a global, simultaneous optimization of a large number of parameters including the 5 basic astrometric parameters of each star (about 1 Billion in total), the time-varying attitude of the satellite
(a few Million), and a number of calibration parameters (a few 10.000).
The process is iterative and in the end gives the best match between the model parameters and the actual observations. The stellar positions are two of the five astrometric parameter of each object.
Q10. What is the level of accuracy you have achieved so far?
The accuracies depend on the brightnesses of the stars – the brighter a star, the higher is the achievable accuracy. In DR1 the typical uncertainty is about 0.3 mas for the positions and parallaxes, and about 1 mas yr^-1 for the proper motions.
For positions and parallaxes a systematic component of another 0.3 mas should be added. With DR2 we are aiming to reduce these formal errors by at least a factor 3 and likewise eliminate systematic errors by the same or a larger amount.
There is then still quite some way to go to reach the end-of-mission accuracies (e.g. 25 micro-arcsec for a magnitude 15 star) but the DR2 catalogue will already become a game changer for astronomy!
Q11. The first catalogue of more than a billion stars from ESA’s Gaia satellite was published on 14 September 2016 – the largest all-sky survey of celestial objects to date. What data is in this catalog? What is the size and structure of the information you analysed so far?
Gaia DR1 contains astrometry, G-band photometry (brightnesses), and a modest number of variable star light curves, for a total of 1 142 679 769 sources [See Gaia Data Release 1. Summary of the astrometric, photometric, and survey properties]. For the large majority of those we only provide position and magnitude but about 2 Million stars also have parallaxes and proper motions. In DR2 these numbers will be substantially larger.
The information is structured in simple, easy-to-use tables which can be queried via the central Gaia Archive and a number of other data centres around the world.
Q12. What insights have been derived so far by analysing this data?
The astronomical community eagerly grabbed the DR1 data and since 14 September a couple of hundred scientific articles have appeared in peer-reviewed astronomical journals covering a large breads of topics.
Only to give one example: A new so-called open cluster of stars was discovered very close to the brightest star in the night sky, Sirius. All previous surveys had missed it!
Q13 How do you offer a proper infrastructure and middleware upon which scientists will be able to do exploration and modeling with this huge data set?
That is a very good question! At the moment the archive system does not allow yet real big data-mining using the entire large Gaia data set. Up to know we do not know precisely yet what scientists will want to do with the Gaia data in the end.
There is the “traditional” astronomical research which mostly uses only subsets of the data, e.g. all stars in a particular area of the sky. Such data requests can be satisfied with traditional queries to a RDBMS.
But in the future we expect also applications which will need data mining capabilities and we are experimenting with a number of different approaches using the “code-to-the-data” paradigm. The idea is that scientists will be able to upload and deploy their codes directly through a platform which allows execution with quick data access close to the archive.
For DR2 this will only be available for DPAC-internal use but, depending on experiences gained, as per DR3 it might become a service for public use. One technology we are looking at is Apache Spark for big data mining.
Q14. What software technologies do you use for accessing the Gaia catalogue and associated data?
As explained above, at the moment we are offering access to the catalogue only through a traditional RDBMS system which allows queries to be submitted in a special SQL dialect called ADQL (Astronomical Data Query Language). This DB system is not using InterSystems Caché but Postgres.
Q15. In addition to the query access, how do you “visualize” such data? Which “big data” techniques do you use for histograms production?
Visualization is done with a special custom-made application that sits close to the archive and is using not the raw data but pre-computed special objects especially constructed for fast visualization. We are not routinely using any big data techniques but are experimenting with a few key concepts.
For visualization one interesting novel application is called vaex and we are looking at it.
Histogramming of the entire data set is likewise done using pre-canned summary statistics which was generated when the data was ingested into the archive. The number of users really wanting the entire data set and this kind of functionality is very limited at the moment. We as well as the scientific community are still learning what can be done with the Gaia data set.
Q16. Which “big data” software and hardware technologies did use so far? And what are the lessons learned?
Again, we are only starting to look into big data technologies that may be useful for us. Until now most of the effort has gone into robustifying all systems and prepare DR1 and now DR2 for April next year. One issue is always that the Gaia data is so peculiar and special that COTS solutions rarely work. Most of the software systems we use are special developments.
Q.17 What are the main technical challenges ahead?
As far as the daily systems are concerned we are now finally in the routine phase. The main future challenges lie in robustifying and validating the big outer iterative loop that I described above. It has not been tested yet, so, we are executing it for the first time with real flight data.
Producing DR3 (mid to late 2020) will be a challenge as this for the first time involves output from all CUs and the results from the outer iterative loop. DR4 around end 2022 is then the final release for the nominal mission and for that we want to release “everything”. This means also the individual observation data (“epoch data”) which will inflate the total volume served by the archive by a factor 100 or so.
Qx Anything else you wish to add?
Gaia continues to be a challenging mission in all areas even after 4 years of operation. In total we have processed almost 800 Billion (=800,000 Million) astrometric, 160 Billion (=160,000 Million) photometric and more than 15 Billion spectroscopic observation which is the largest astronomical dataset from a science space mission until the present day.
Gaia is fulfilling its promises in every regard and the scientific community is eagerly looking into what is available already now and the coming data releases. This continues to be a great source of motivation for everybody working on this great mission.
————————————————–

Uwe Lammers. My academic background is in physics and computer science. After my PhD I joined ESA to first work on the X-ray missions EXOSAT, Beppo-SAX, and XMM-Newton before getting interested in Gaia in 2005. The first years I led the development of the so-called Astrometric Global Iterative Solution (AGIS) system and then became Gaia’s Science Operations Manager in 2014.
References
– The astrometric core solution for the Gaia mission. Overview of models, algorithms, and software implementation
L. Lindegren, U. Lammers et al. Astronomy & Astrophysics, Volume 538, id.A78, 47 pp. February 2012, DOI: 10.1051/0004-6361/201117905
– Gaia Data Release 1. Summary of the astrometric, photometric, and survey properties A.G.A. Brown and Gaia Collaboration, Astronomy & Astrophysics, Volume 595, id.A2, 23 pp. November 2016, DOI: 10.1051/0004-6361/201629512
– Gaia Data Release 1. Astrometry: one billion positions, two million proper motions and parallaxes L. Lindegren, U. Lammers, et al. Astronomy & Astrophysics, Volume 595, id.A4, 32 pp. November 2016, DOI: 10.1051/0004-6361/201628714
– The Gaia Archive, Alcione Moraet al. Astrometry and Astrophysics in the Gaia Sky, Proceedings IAU Symposium No. 330, 2017
Related Posts
– The Gaia mission in 2015. Interview with Uwe Lammers and Vik Nagjee , ODBMS Industry Watch, March 24, 2015
– The Gaia mission, one year later. Interview with William O’Mullane. ODBMS Industry Watch, January 16, 2013
– Objects in Space vs. Friends in Facebook. ODBMS Industry Watch, April 13, 2011
– Objects in Space. ODBMS Industry Watch, February 14, 2011
Follow us on Twitter: @odbmsorg
##
“Data is always a bottleneck.”–Jack Levis.
I have interviewed Jack Levis, Senior Director, Industrial Engineering at UPS. Jack shared with us some of the main lessons learned from the development of the “On Road Integrated Optimization and Navigation system” (ORION).
RVZ
Q1. Can you give us a background on UPS and some of the challenges that UPS faces?
Jack Levis: The e-Commerce revolution brings with it some interesting challenges. First, from a cost-to-serve standpoint, residential deliveries are less dense in terms of distance between stops and pieces per stop. Second, residential customers want personalization in their delivery experience, which adds cost and other challenges. UPS has met these challenges by utilizing operations technology and advanced analytics.
Q2. UPS won the 2016 Franz Edelman prize for its On Road Integrated Optimization and Navigation system (ORION). You lead the four-year long development of ORION. ORION completed deployment in 2016. How did you manage to reduce 100 million miles driven annually and save UPS $300 to $400 million each year?
Jack Levis: UPS has a long history of innovation and constant improvement. The ORION story actually began in the late 1990s when UPS started building our Package Flow Technologies (PFT) data infrastructure. PFT created predictive models, a “virtual network”, and a suite of planning and execution tools. This was the foundation for ORION. PFT deployed in 2003 and reduced 85 million miles driven per year.
ORION was built on this robust foundation. Using the discipline of operations research, ORION created a proprietary route optimization brain. Research into ORION began in 2003, and the first model was field tested in 2008 in Gettysburg, Pennsylvania. The result was that ORION could find ways to serve all customers in a route while at the same time reducing cost.
It does so by systematically analyzing more than 200,000 different ways a route can be run and then presenting the optimal route to a driver. It does so in seconds.
The ORION savings of 100 million miles and $300 million to $400 million annually is in addition to the savings from PFT.
Q3. What data infrastructure and data analytics tools did you use to implement ORION?
Jack Levis: As mentioned above, ORION sits on top of our proprietary PFT technology. The analytics tools are also built in house by UPS’s operations research team. The marriage of operations research, IT and business processes is part of the ORION success story.
Q4. What were the main challenges and pitfalls you encountered in the project?
Jack Levis: The first challenge was to build the ORION optimization engine (brain) that could not only meet service while reducing cost but do so while thinking like a driver. This meant that ORION needed to balance consistency and optimality. It made no sense to throw things up in the air just to save a penny. To do so, UPS had to reevaluate business rules, methods, procedures, etc. In essence, UPS redesigned the delivery process.
The second challenge was ensuring the data fed to ORION was “pristine”, and maps were a major challenge in this regard.
Off-the-shelf maps were not accurate enough. UPS patented a process for utilizing our “big data” infrastructure to help make maps accurate enough for ORION.
For instance, if a speed limit changes or a bridge is out, this edit must be made and updated information sent to ORION. From the time the map is edited, an optimized route can be in a driver’s hands in 30 seconds.
The third and largest challenge was change management. By definition, optimization tools like ORION will require people to change behavior. UPS tested training procedures, new metrics, analysis tools, etc. to ensure the change would take place.
Ultimately, the deployment team grew to 700 people. This team impacted tens of thousands of front-line personnel. The deployment team and the front line are the true heroes of the story.
Q5. What are the three most important lessons learned during this project?
Jack Levis: Never assume you know the answers. The first four years were spent truly understanding the delivery problem. There were many guidelines but few rules. ORION had to turn these guidelines into acceptable algorithms. The team did so by working with drivers and the front line until ORION started thinking like a driver.
Data is always a bottleneck. Initially, the team thought maps that could be purchased would be accurate enough. When the optimizations gave bad answers, the team looked at the algorithm. As it turned out, the problem was the map data accuracy and not the algorithm. The algorithm could not be truly tested until the data inputs were “pristine.”
Don’t forget deployment and change management. Do not think that “If you build it, they will come.” ORION required extensive change management and front-line support. It is important to have support from the top and show that the results are achievable. Without understanding the importance of change management, new programs run the risk of becoming a “flavor of the month.”
Q6. Can you recommend three best practices so that other projects can have a smoother path?
Jack Levis: Focus on decisions. Put effort into areas where a better decision will make an impact.
Focus on deployment and data from the beginning. The ORION deployment strategy is now the standard for all operations projects at UPS.
Ensure the right data infrastructure is in place with proper data.
Utilize appropriate associations and networking for help like the Institute of Operations Research and the Management Sciences (INFORM).
Q7. What were the key elements that made this project a success?
Jack Levis: Support from senior management to allow the team to continue the research even when failures occurred.
Proving that benefits could be achieved. The teams ran 11 different tests in multiple operations to test things like benefit achievement, training, metrics, best practices, etc.
No site could be deployed unless an entrance criteria was met. No site could say deployment was completed unless exit criteria was met.
There was constant evaluation of metrics and issues.
ORION was built inside a delivery process. Operations do not know they are using such advanced mathematics. They are just doing their job.
Q8. In general, how do you evaluate if the insight you obtain from data analytics is “correct” or “good” or “relevant” to the problem domain?
Jack Levis: The key is to start with decisions. See below (Q9).
Q9. What are the typical mistakes done when analyzing data for a large scale data project? How can they be avoided in practice?
Jack Levis: We do NOT focus on technology. We focus on decisions. Big data is a how, not a what. We care less about Big Data than we care about big insight and big impact.
By focusing on decision that need to be made, priorities become clearer. Ensuring decision-makers have the right information to make decisions and then measuring the impact of better decisions helps with the process. It helps to ensure the proper data is in place to make an impact.
If an impact can be made from a simple tool, that is a good thing.
Q10. What are the main barriers to applying machine learning at scale?
Jack Levis: The largest barrier is not focusing on decisions.
Q11. What is your next project?
Jack Levis: UPS will build out ORION.
ORION will begin making suggestions to drivers throughout the day. ORION will also provide navigation to drivers.
We are also working on ORION making “dispatch” decisions. ORION will begin deciding which driver should serve customers. In essence, at some point it will automate the pickup/delivery process.
Simultaneously, UPS will provide ORION-like functionality in other areas of the business.
There will be a PFT/ORION for Transportation; city-to-city movements.
There will be a PFT/ORION for inside the building operations; sorting, loading, moving of vehicles, etc.
Qx Anything else you wish to add?
Jack Levis: The advances mentioned above along with automated facilities will begin to automate and optimize the network.
Today, ORION optimizes a single driver. Tomorrow, ORION will begin to optimize an entire delivery area.
UPS has a bold vision to optimize an entire network from end to end.
————————
Jack Levis, Senior Director, Industrial Engineering, UPS
“Through the marriage of technology, information, and analytics UPS reduces cost and improves services. These advanced technologies streamline our business processes and ultimately benefit our customers.”
Jack Levis, Senior Director of Industrial Engineering, drives the development of operational technology solutions. These solutions require advanced analytics to reengineer current processes to streamline the business and maximize productivity.
Jack has been the business owner and process designer for UPS’s Package Flow Technology suite of systems, which includes its award-winning delivery optimization, ORION (On Road Integrated Optimization and Navigation). These tools have been a breakthrough for UPS, resulting in a reduction of 185 million miles driven each year.
ORION has completed deployment and is providing significant operational benefits to UPS and its customers. UPS estimates that ORION is reducing costs by $300 million to $400 million per year.
Jack earned his Bachelor of Arts degree in psychology, from California State University Northridge. He also holds a Master’s Certificate in Project Management from George Washington University.
Jack is a fellow of the Institute for Operations Research and Management Sciences (INFORMS), receiving their prestigious Kimball Medal and the President’s Award.
Jack holds advisory council positions for multiple universities and associations, including the U.S. Census Bureau Scientific Advisory Committee.
————————-
Resources
–UPS Wins 2016 INFORMS Franz Edelman Award For Changing The Future Of Package Delivery
–UPS On-Road Integrated Optimization and Navigation (ORION)
–UPS ORION: The Driver Helper (Infographic)
Related Posts
– How Algorithms can untangle Human Questions. Interview with Brian Christian
– On Digital labor: Technology, Challenges and Opportunities. Interview with Michael Henry
– Big Data Management at American Express. Interview with Sastry Durvasula and Kevin Murray.
Follow us on Twitter: @odbmsorg
##
“Spark and Ignite can complement each other very well. Ignite can provide shared storage for Spark so state can be passed from one Spark application or job to another. Ignite can also be used to provide distributed SQL with indexing that accelerates Spark SQL by up to 1,000x.”–Nikita Ivanov.
I have interviewed Nikita Ivanov,CTO of GridGain.
Main topics of the interview are Apache Ignite, Apache Spark and MySQL, and how well they perform on big data analytics.
RVZ
Q1. What are the main technical challenges of SaaS development projects?
Nikita Ivanov: SaaS requires that the applications be highly responsive, reliable and web-scale. SaaS development projects face many of the same challenges as software development projects including a need for stability, reliability, security, scalability, and speed. Speed is especially critical for modern businesses undergoing the digital transformation to deliver real-time services to their end users. These challenges are amplified for SaaS solutions which may have hundreds, thousands, or tens of thousands of concurrent users, far more than an on-premise deployment of enterprise software.
Fortunately, in-memory computing offers SaaS developers solutions to the challenges of speed, scale and reliability.
Q2. In your opinion, what are the limitations of MySQL® when it comes to big data analytics?
Nikita Ivanov: MySQL was originally designed as a single-node system and not with the modern data center concept in mind. MySQL installations cannot scale to accommodate big data using MySQL on a single node. Instead, MySQL must rely on sharding, or splitting a data set over multiple nodes or instances, to manage large data sets. However, most companies manually shard their database, making the creation and maintenance of their application much more complex. Manually creating an application that can then perform cross-node SQL queries on the sharded data multiplies the level of complexity and cost.
MySQL was also not designed to run complicated queries against massive data sets. MySQL optimizer is quite limited, executing a single query at a time using a single thread. A MySQL query can neither scale among multiple CPU cores in a single system nor execute distributed queries across multiple nodes.
Q3. What solutions exist to enhance MySQL’s capabilities for big data analytics?
Nikita Ivanov: For companies which require real-time analytics, they may attempt to manually shard their database. Tools such as Vitess, a framework YouTube released for MySQL sharding, or ProxySQL are often used to help implement sharding.
To speed up queries, caching solutions such as Memcached and Redis are often deployed.
Many companies turn to data warehousing technologies. These solutions require ETL processes and a separate technology stack which must be deployed and managed. There are many external solutions, such as Hadoop and Apache Spark, which are quite popular. Vertica and ClickHouse have also emerged as analytics solutions for MySQL.
Apache Ignite offers speed, scale and reliability because it was built from the ground up as a high performant and highly scalable distributed in-memory computing platform.
In contrast to the MySQL single-node design, Apache Ignite automatically distributes data across nodes in a cluster eliminating the need for manual sharding. The cluster can be deployed on-premise, in the cloud, or in a hybrid environment. Apache Ignite easily integrates with Hadoop and Spark, using in-memory technology to complement these technologies and achieve significantly better performance and scale. The Apache Ignite In-Memory SQL Grid is highly optimized and easily tuned to execute high performance ANSI-99 SQL queries. The In-Memory SQL Grid offer access via JDBC/ODBC and the Ignite SQL API for external SQL commands or integration with analytics visualization software such as Tableau.
Q4. What is exactly Apache® Ignite™?
Nikita Ivanov: Apache Ignite is a high-performance, distributed in-memory platform for computing and transacting on large-scale data sets in real-time. It is 1,000x faster than systems built using traditional database technologies that are based on disk or flash technologies. It can also scale out to manage petabytes of data in memory.
Apache Ignite includes the following functionality:
· Data grid – An in-memory key value data cache that can be queried
· SQL grid – Provides the ability to interact with data in-memory using ANSI SQL-99 via JDBC or ODBC APIs
· Compute grid – A stateless grid that provides high-performance computation in memory using clusters of computers and massive parallel processing
· Service grid – A service grid in which grid service instances are deployed across the distributed data and compute grids
· Streaming analytics – The ability to consume an endless stream of information and process it in real-time
· Advanced clustering – The ability to automatically discover nodes, eliminating the need to restart the entire cluster when adding new nodes
Q5. How Apache Ignite differs from other in-memory data platforms?
Nikita Ivanov: Most in-memory computing solutions fall into one of three types: in-memory data grids, in-memory databases, or a streaming analytics engine.
Apache Ignite is a full-featured in-memory computing platform which includes an in-memory data grid, in-memory database capabilities, and a streaming analytics engine. Furthermore, Apache Ignite supports distributed ACID compliant transactions and ANSI SQL-99 including support for DML and DDL via JDBC/ODBC.
Q6. Can you use Apache® Ignite™ for Real-Time Processing of IoT-Generated Streaming Data?
Nikita Ivanov: Yes, Apache Ignite can ingest and analyze streaming data using its streaming analytics engine which is built on a high-performance and scalable distributed architecture. Because Apache Ignite natively integrates with Apache Spark, it is also possible to deploy Spark for machine learning at in-memory computing speeds.
Apache Ignite supports both high volume OLTP and OLAP use cases, supporting Hybrid Transactional Analytical Processing (HTAP) use cases, while achieving performance gains of 1000x or greater over systems which are built on disk-based databases.
Q7. How do you stream data to an Apache Ignite cluster from embedded devices?
Nikita Ivanov: It is very easy to stream data to an Apache Ignite cluster from embedded devices.
The Apache Ignite streaming functionality allows for processing never-ending streams of data from embedded devices in a scalable and fault-tolerant manner. Apache Ignite can handle millions of events per second on a moderately sized cluster for embedded devices generating massive amounts of data.
Q8. Is this different then using Apache Kafka?
Nikita Ivanov: Apache Kafka is a distributed streaming platform that lets you publish and subscribe to data streams. Kafka is most commonly used to build a real-time streaming data pipeline that reliably transfers data between applications. This is very different from Apache Ignite, which is designed to ingest, process, analyze and store streaming data.
Q9. How do you conduct real-time data processing on this stream using Apache Ignite?
Nikita Ivanov: Apache Ignite includes a connector for Apache Kafka so it is easy to connect Apache Kafka and Apache Ignite. Developers can either push data from Kafka directly into Ignite’s in-memory data cache or present the streaming data to Ignite’s streaming module where it can be analyzed and processed before being stored in memory.
This versatility makes the combination of Apache Kafka and Apache Ignite very powerful for real-time processing of streaming data.
Q10. Is this different then using Spark Streaming?
Nikita Ivanov: Spark Streaming enables processing of live data streams. This is merely one of the capabilities that Apache Ignite supports. Although Apache Spark and Apache Ignite utilize the power of in-memory computing, they address different use cases. Spark processes but doesn’t store data. It loads the data, processes it, then discards it. Ignite, on the other hand, can be used to process data and it also provides a distributed in-memory key-value store with ACID compliant transactions and SQL support.
Spark is also for non-transactional, read-only data while Ignite supports non-transactional and transactional workloads. Finally, Apache Ignite also supports purely computational payloads for HPC and MPP use cases while Spark works only on data-driven payloads.
Spark and Ignite can complement each other very well. Ignite can provide shared storage for Spark so state can be passed from one Spark application or job to another. Ignite can also be used to provide distributed SQL with indexing that accelerates Spark SQL by up to 1,000x.
Qx. Is there anything else you wish to add?
Nikita Ivanov: The world is undergoing a digital transformation which is driving companies to get closer to their customers. This transformation requires that companies move from big data to fast data, the ability to gain real-time insights from massive amounts of incoming data. Whether that data is generated by the Internet of Things (IoT), web-scale applications, or other streaming data sources, companies must put architectures in place to make sense of this river of data. As companies make this transition, they will be moving to memory-first architectures which ingest and process data in-memory before offloading to disk-based datastores and increasingly will be applying machine learning and deep learning to make understand the data. Apache Ignite continues to evolve in directions that will support and extend the abilities of memory-first architectures and machine learning/deep learning systems.
——–
Nikita IvanovFounder & CTO, GridGain,
Nikita Ivanov is founder of Apache Ignite project and CTO of GridGain Systems, started in 2007. Nikita has led GridGain to develop advanced and distributed in-memory data processing technologies – the top Java in-memory data fabric starting every 10 seconds around the world today. Nikita has over 20 years of experience in software application development, building HPC and middleware platforms, contributing to the efforts of other startups and notable companies including Adaptec, Visa and BEA Systems. He is an active member of Java middleware community, contributor to the Java specification. He’s also a frequent international speaker with over two dozen of talks on various developer conferences globally.
Resources
– Apache Ignite Community Resources
– Yardstick Apache Ignite Benchmarks
–Accelerate MySQL for Demanding OLAP and OLTP Use Cases with Apache Ignite
–Misys Uses GridGain to Enable High Performance, Real-Time Data Processing
–The Spark Python API (PySpark)
Related Posts
Follow ODBMS.org on Twitter: @odbmsorg
##
” I like the idea behind programmable, communicating devices and I believe there is great potential for useful applications. At the same time, I am extremely concerned about the safety, security and privacy of such devices.” –Vint G. Cerf
I had the pleasure to interview Vinton G. Cerf. Widely known as one of the “Fathers of the Internet,” Cerf is the co-designer of the TCP/IP protocols and the architecture of the Internet. Main topic of the interview is the Internet of Things (IoT) and its challenges, especially the safety, security and privacy of IoT devices.
Vint is currently Chief Internet Evangelist for Google.
RVZ
Q1. Do you like the Internet of Things (IoT)?
Vint Cerf: This question is far too general to answer. I like the idea behind programmable, communicating devices and I believe there is great potential for useful applications. At the same time, I am extremely concerned about the safety, security and privacy of such devices. Penetration and re-purposing of these devices can lead to denial of service attacks (botnets), invasion of privacy, harmful dysfunction, serious security breaches and many other hazards. Consequently the makers and users of such devices have a great deal to be concerned about.
Q2. Who is going to benefit most from the IoT?
Vint Cerf: The makers of the devices will benefit if they become broadly popular and perhaps even mandated to become part of local ecosystem. Think “smart cities” for example. The users of the devices may benefit from their functionality, from the information they provide that can be analyzed and used for decision-making purposes, for example. But see Q1 for concerns.
Q3. One of the most important requirement for collections of IoT devices is that they guarantee physical safety and personal security. What are the challenges from a safety and privacy perspective that the pervasive introduction of sensors and devices pose? (e.g. at home, in cars, hospitals, wearables and ingestible, etc.)
Vint Cerf: Access control and strong authentication of parties authorized to access device information or control planes will be a primary requirement. The devices must be configurable to resist unauthorized access and use. Putting physical limits on the behavior of programmable devices may be needed or at least advisable (e.g., cannot force the device to operate outside of physically limited parameters).
Q5. Consumers want privacy. With IoT physical objects in our everyday lives will increasingly detect and share observations about us. How is it possible to reconcile these two aspects?
Vint Cerf: This is going to be a tough challenge. Videocams that help manage traffic flow may also be used to monitor individuals or vehicles without their permission or knowledge, for example (cf: UK these days). In residential applications, one might want (insist on) the ability to disable the devices manually, for example. One would also want assurances that such disabling cannot be defeated remotely through the software.
Q6. Let`s talk about more about security. It is reported that badly configured “smart devices” might provide a backdoor for hackers. What is your take on this?
Vint Cerf: It depends on how the devices are connected to the rest of the world. A particularly bad scenario would have a hacker taking over the operating system of 100,000 refrigerators. The refrigerator programming could be preserved but the hacker could add any of a variety of other functionality including DDOS capacity, virus/worm/Trojan horse propagation and so on.
One might want the ability to monitor and log the sources and sinks of traffic to/from such devices to expose hacked devices under remote control, for example. This is all a very real concern.
Q7. What measures can be taken to ensure a more “secure” IoT?
Vint Cerf: Hardware to inhibit some kinds of hacking (e.g. through buffer overflows) can help. Digital signatures on bootstrap programs checked by hardware to inhibit boot-time attacks. Validation of software updates as to integrity and origin. Whitelisting of IP addresses and identifiers of end points that are allowed direct interaction with the device.
Q8. Is there a danger that IoT evolves into a possible enabling platform for cyber-criminals and/or for cyber war offenders?
Vint Cerf: There is no question this is already a problem. The DYN Corporation DDOS attack was launched by a botnet of webcams that were readily compromised because they had no access controls or well-known usernames and passwords. This is the reason that companies must feel great responsibility and be provided with strong incentives to limit the potential for abuse of their products.
Q9. What are your personal recommendations for a research agenda and policy agenda based on advances in the Internet of Things?
Vint Cerf: Better hardware reinforcement of access control and use of the IOT computational assets. Better quality software development environments to expose vulnerabilities before they are released into the wild. Better software update regimes that reduce barriers to and facilitate regular bug fixing.
Q10. The IoT is still very much a work in progress. How do you see the IoT evolving in the near future?
Vint Cerf: Chaotic “standardization” with many incompatible products on the market. Many abuses by hackers. Many stories of bugs being exploited or serious damaging consequences of malfunctions. Many cases of “one device, one app” that will become unwieldy over time. Dramatic and positive cases of medical monitoring that prevents serious medical harms or signals imminent dangers. Many experiments with smart cities and widespread sensor systems.
Many applications of machine learning and artificial intelligence associated with IOT devices and the data they generate. Slow progress on common standards.
—————
Vinton G. Cerf co-designed the TCP/IP protocols and the architecture of the Internet and is Chief Internet Evangelist for Google. He is a member of the National Science Board and National Academy of Engineering and Foreign Member of the British Royal Society and Swedish Royal Academy of Engineering, and Fellow of ACM, IEEE, AAAS, and BCS.
Cerf received the US Presidential Medal of Freedom, US National Medal of Technology, Queen Elizabeth Prize for Engineering, Prince of Asturias Award, Japan Prize, ACM Turing Award, Legion d’Honneur and 29 honorary degrees.
Resources
– European Commission, Internet of Things Privacy & Security Workshop’s Report,10/04/2017
– Securing the Internet of Things. US Homeland Security, November 16, 2016
Related Posts
– Security in the Internet of Things, McKinsey & Company,May 2017
–Interview to Vinton G. Cerf. ODBMS Industry Watch, July 27, 2009
– Five Challenges to IoT Analytics Success. By Dr. Srinath Perera. ODBMS.org, September 23, 2016
Follow us on Twitter: @odbsmorg
##
On the challenges and opportunities for the UK public sector. Interview with Sarbjit Singh Bakhshi
“Looking across the senior leadership in Government, very few top Civil Servants and Ministers have come from a technical background. Most Departments will have a CTO/CIO person who may or may not also been drawn from a relevant technical background. Those that are drawn from such a background and are empowered by their senior leadership, deliver a clear advantage to their organisation.”–Sarbjit Singh Bakhshi.
I have interviewed Sarbjit Singh Bakhshi, Director of Government Affairs at Maxeler Technologies. We covered in the interview the challenges and opportunities for the UK public sector in the Post-Brexit Era.
RVZ
Q1. It has been suggested that some of the key challenges in government IT are: i) change aversion, ii) lack of technocratic leadership, and iii) processes that don’t scale down. What is your take on this?
Sarbjit Singh Bakhshi: Looking across the senior leadership in Government, very few top Civil Servants and Ministers have come from a technical background. Most Departments will have a CTO/CIO person who may or may not also been drawn from a relevant technical background. Those that are drawn from such a background and are empowered by their senior leadership, deliver a clear advantage to their organisation.
Where these people are not empowered, you will often find bad technical choices made by Departments that seem to be driven by short term commercial gain rather than long term interests. In the worst cases, they’d rather patch up systems knowing they will fail in the medium term than invest in a long term solution. This leads to rather inevitable problems when they can no longer pursue this strategy.
There are also issues in terms of understanding the total cost of computing. The cost of inefficient systems that consume vast amounts of electricity are often hidden from decision makers as running costs come out of an operational budget for the Department. So the decision makers will focus on a low purchase price for some systems even if the systems cost more in the long run to operate.
There needs to be a greater understanding of the challenges of running Government IT and there should be changes in leadership to support this. A focus on total cost of ownership (including transition costs) needs to be taken into account.
Q2. What are the main barriers to use new and innovative technologies in the UK Government?
Sarbjit Singh Bakhshi: Like most advanced countries that have been running big IT programmes from the 1950’s, the UK Government has a very heterogeneous IT estate and compatibility with older and archaic systems can still be a problem. There are further issues in terms of the threat of cyber warfare that need to be considered also when delivering new systems into this environment.
There are also issues around procurement which can stifle innovative and iterative approaches to technology deployment.
The recent move to create the G-Cloud does help in this respect, but we still see too many OJEU procedures which often crowd out smaller companies from the opportunities of working with Government.
Q3. How will Brexit affect the UK’s tech industry?
Sarbjit Singh Bakhshi: As Article 50 has just been invoked and nothing has been agreed it is a little too soon to tell.
Obviously, there are concerns in the UK’s Tech Industry around getting and recruiting the best staff from around the world in the UK, access to the Digital Single Market and any agreements the EU has around the safe storage of data. I’m sure these will all be top of mind for British negotiators.
Q4. What are the challenges and opportunities for the UK public sector in the Post-Brexit Era?
Sarbjit Singh Bakhshi: The challenges are manifold, the applicability of EU laws and the future of EU citizens in the UK and how that affects the administration of the country are probably paramount.
There are also opportunities for the British tech industry in the creation of parallel Governmental systems to replace the ones we are currently using that are from the EU.
Q5. What were your main motivations to leave the Government and go to Industry?
Sarbjit Singh Bakhshi: After many successful years of operation, Maxeler is emerging into an exciting new space. Maxeler has its first cloud based product with Amazon and is able to offer onsite and/or elastic cloud operations for the first time in its history. With more Government work moving to the cloud, this is an exciting time as we can bring the high levels of Maxeler performance to Government data sets at a reasonable cost.
We have applications in cyber security, big – complex data analysis and real time networking that are essential for Governments to deal with the emerging threats from around the world.
If one considers the wider context of Government – including research and scientific computing, Maxeler also has a good story to tell. We are in STFC Daresbury and can provide exceptionally performant computing at low energy cost for supercomputer environments. Complementing this we have an active university programme with over 150 top universities around the world where scientists are using DataFlow Engines for a variety of computational tasks that are outperforming traditional CPU setups.
Maxeler is ready to offer services to the UK Government as an approved G-Cloud supplier and can use its experience with large data sets to help Government move from on-premises hosting to take advantages of the cloud and its ultra-fast computing in line with the Government’s ‘Cloud First’ technology policy..
Q6. What are your aims and goals as new appointed Director of Government Affairs at Maxeler Technologies?
Sarbjit Singh Bakhshi: Improve our relations with Government in the UK and elsewhere. Maxeler technologies has experience of working with high pressure financial institutions, we’d like to offer Government the same opportunity to deal with its most pressing computational problems in a ultra-performant, energy efficient and easy to manage way.
——————–
Sarbjit Bakhshi joined Maxeler Technologies from a long career working for the British Government. Working mainly in areas of European Union Negotiations and Technology policy and promotion, Sarbjit’s appointment marks a new phase for Maxeler Technologies and its commitment to work with Government in the UK and overseas as part of its’ next phase of expansion.
Resources
– Opening up data: G-Cloud 9 application statistics. Digital Marketplace team, 5 April 2017
–G-Cloud 9: sharing draft legal documents. Digital Marketplace team, 3 March 2017
Related Posts
– Maxeler’s increased focus on Government, ODBMS.org, MARCH 18, 2017
Follow us on Twitter: @odbmsorg
##
“I’ve found the best engineers actually have art backgrounds or interests. The key capability is being able to see problems from multiple perspectives, and realizing there are multiple solutions to a problem. Music, photography and other arts encourage that.”–Niels Meersschaert.
I have interviewed Niels Meersschaert, Chief Technology Officer at Qualia. The Qualia team relies on over one terabyte of graph data in Neo4j, combined with larger amounts of non-graph data to provide major companies with consumer insights for targeted marketing and advertising opportunities.
RVZ
Q1. Your background is in Television & Film Production. How does it relate to your current job?
Niels Meersschaert: Engineering is a lot like producing. You have to understand what you are trying to achieve, understand what parts and roles you’ll need to accomplish it, all while doing it within a budget. I’ve found the best engineers actually have art backgrounds or interests. The key capability is being able to see problems from multiple perspectives, and realizing there are multiple solutions to a problem. Music, photography and other arts encourage that. Engineering is both art and science and creativity is a critical skill for the best engineers. I also believe that a breath of languages is critical for engineers.
Q2. Your company collects data on more than 90% of American households. What kind of data do you collect and how do you use such data?
Niels Meersschaert: We focus on high quality data that is indicative of commercial intent. Some examples include wishlist interaction, content consumption, and location data. While we have the breath of a huge swath of the American population, a key feature is that we have no personally identifiable information. We use anonymous unique identifiers.
So, we know this ID did actions indicative of interest in a new SUV, but we don’t know their name, email address, phone number or any other personally identifiable information about a consumer. We feel this is a good balance of commercial need and individual privacy.
Q3. If you had to operate with data from Europe, what would be the impact of the new EU General Data Protection Regulation (GDPR) on your work?
Niels Meersschaert: Europe is a very different market than the U.S. and many of the regulations you mentioned do require a different approach to understanding consumer behaviors. Given that we avoid personal IDs, our approach is already better situated than many peers, that rely on PII.
Q4. Why did you choose a graph database to implement your system consumer behavior tracking system?
Niels Meersschaert: Our graph database is used for ID management. We don’t use it for understanding the intent data, but rather recognizing IDs. Conceptually, describing the various IDs involved is a natural fit for a graph.
As an example, a conceptual consumer could be thought of as the top of the graph. That consumer uses many devices and each device could have 1 or more anonymous IDs associated with it, such as cookie IDs. Each node can represent an associated device or ID and the relationships between each node allow us to see the path. A key element we have in our system is something we call the Borg filter. It’s a bit of a reference to Star Trek, but essentially when we find a consumer is too connected, i.e. has dozens or hundreds of devices, we remove all those IDs from the graph as clearly something has gone wrong. A graph database makes it much easier to determine how many connected nodes are at each level.
Q5. Why did you choose Neo4j?
Niels Meersschaert: Neo4J had a rich query language and very fast performance, especially if your hot set was in RAM.
Q6. You manage one terabyte of graph data in Neo4j. How do you combine them with larger amounts of non-graph data?
Niels Meersschaert: You can think of the graph as a compression system for us. While consumer actions occur on multiple devices and anonymous IDs, they represent the actions of a single consumer. This actually simplifies things for us, since the unique grouping IDs is much smaller than the unique source IDs. It also allows us to eliminate non-human IDs from the graph. This does mean we see the world in different ways they many peers. As an example, if you focus only on cookie IDs, you tend to have a much larger number of unique IDs than actual consumers those represent. Sadly, the same thing happens with website monthly uniques, many are highly inflated both on the number of unique people they represent, but also since many of the IDs are non-human. Ultimately, the entire goal of advertising is to influence consumers, so we feel that having the better representation of actual consumers allows us to be more effective.
Q7. What are the technical challenges you face when blending data with different structure?
Niels Meersschaert: A key challenge is some unifying element between different systems or structures that link data. What we did with Neo4J is create a unique property on the nodes that we use for interchange. The internal node IDs that are part of Neo4J aren’t something we use except internally within the graph DB.
Q8. If your data is sharded manually, how do you handle scalability?
Niels Meersschaert: We don’t shard the data manually, but scalability is one of the biggest challenges. We’ve spent a lot of time tuning queries and grouping operations to take advantage of some of the capabilities of Neo4J and to work around some limitations it has. The vast majority of graph customers wouldn’t have the volume nor the volatility of data that we do, so our challenges are unique.
Q9. What other technologies do you use and how they interact with Neo4j?
Niels Meersschaert: We use the classic big data tools like Hadoop and Spark. We also use MongoDB and Google’s Big Query. If you look at the graph as the truth set of device IDs, we interact with it on ingestion and export only. Everything in the middle can operate on the consumer ID, which is far more efficient.
Q10. How do you measure the ROI of your solution?
Niels Meersschaert: There are a few factors we consider. First is how much does the infrastructure cost us to process the data and output? How fast is it in terms of execution time? How much development effort does it take relative to other solutions? How flexible is it for us to extend it? This is an ever evolving situation and one we always look at how to improve, especially as a smaller business.
———————————-
Niels Meersschaert
I’ve been coding since I was 7 years old on an Apple II. I’d built radio control model cars and aircraft as a child and built several custom chassis using controlled flex as suspension to keep weight & parts count down. So, I’d had an early interest in both software and physical engineering.
My father was from the Netherlands and my maternal grandfather was a linguist fluent in 43 languages. As a kid, my father worked for the airlines, so we traveled often to Europe to see family, so I grew up multilingual. Computer languages are just different ways to describe something, the basic concepts are similar, just as they are in spoken languages albeit with different grammatical and syntax structure. Whether you’re speaking French, or writing a program in Python or C, the key is you are trying to get your communication across to the target of your message, whether it is another person or a computer.
I originally started university in aeronautical engineering, but in my sophomore year, Grumman let go about 3000 engineers, so I didn’t think the career opportunities would be as great. I’d always viewed problem solutions as a combination of art & science, so I switched majors to one in which I could combine the two.
After school I worked producing and editing commercials and industrials, often with special effects. I got into web video early on & spent a lot of time on compression and distribution systems. That led to working on search, and bringing the linguistics back front and center again. I then combined the two and came full circle back to advertising, but from the technical angle at Magnetic, where we built search retargeting. At Qualia, we kicked this into high gear, where we understand consumer intent by analyzing sentiment, content and actions across multiple devices and environments and the interaction and timing between them to understand the point in the intent path of a consumer.
Resources
EU General Data Protection Regulation (GDPR):
– Reform of EU data protection rules
– European Commission – Fact Sheet Questions and Answers – Data protection reform
– General Data Protection Regulation (Wikipedia)
– Neo4j Sandbox: The Neo4j Sandbox enables you to get started with Neo4j, with built-in guides and sample datasets for popular use cases.
Related Posts
– LDBC Developer Community: Benchmarking Graph Data Management Systems. ODBMS.org, 6 APR, 2017
– Graphalytics benchmark.ODBMS.org 6 APR, 2017
The Graphalytics benchmark is an industrial-grade benchmark for graph analysis platforms such as Giraph. It consists of six core algorithms, standard datasets, synthetic dataset generators, and reference outputs, enabling the objective comparison of graph analysis platforms.
Follow us on Twitter: @odbmsorg
##
“I do think that one of the fascinating outcomes of the progress of AI is that it gives us a new opportunity and new means of understanding the nature of human intelligence — a chance to better know ourselves. That’s a powerful thing, and a good thing.”–Brian Christian
I have interviewed Brian Christian, coauthor of the bestseller book Algorithms to Live By.
RVZ
Q1. You have worked with cognitive scientist Tom Griffiths (professor of psychology and cognitive science at UC Berkeley) to show how algorithms used by computers can also untangle very human questions. What are the main lessons learned from such a joint work?
Brian Christian: I think ultimately there are three sets of insights that come out of the exploration of human decision-making from the perspective of computer science.
The first, quite simply, is that identifying the parallels between the problems we face in everyday life and some of the canonical problems of computer science can give us explicit strategies for real-life situations. So-called “explore/exploit” algorithms tell us when to go to our favorite restaurant and when to try something new; caching algorithms suggest — counterintuitively — that the messy pile of papers on your desk may in fact be the optimal structure for that information.
Second is that even in cases where there is no straightforward algorithm or easy answer, computer science offers us both a vocabulary for making sense of the problem, and strategies — using randomness, relaxing constraints — for making headway even when we can’t guarantee we’ll get the right answer every time.
Lastly and most broadly, computer science offers us a radically different picture of rationality than the one we’re used to seeing in, say, behavioral economics, where humans are portrayed as error-prone and irrational. Computer science shows us that being rational means taking the costs of computation — the costs of decision-making itself — into account. This leads to a much more human, and much more achievable picture of rationality: one that includes making mistakes and taking chances.
Q2. How did you get the idea to write a book that merges computational models with human psychology (*)?
Brian Christian: Tom and I have known each other for 12 years at this point, and I think both of us have been thinking about some of these questions our whole lives. My background is in computer science and philosophy, and my first book The Most Human Human uses my experience as a human “confederate” in the Turing test to ask a series of questions about how computer science is changing our sense of what it means to be human. Tom’s background is in psychology and machine learning, and his research focuses around developing mathematical models of human cognition. The idea of using computer science as a means for insights about human decision-making really emerged naturally as a consequence of those interests and inquiries. One night we were having dinner together and discussing our current projects and, long story short, we realized we were each writing the same book in parallel! It was immediately apparent that it should take the form of a single collaborative effort.
Q3 In your book you explore the idea of human algorithm design. What is it?
Brian Christian: The idea is, quite simply, to look for optimal ways of approaching everyday human decision making — and to do that by identifying the underlying computational structure of the problems we face in daily life.
“Optimal stopping” problems can teach us about when to look and when to leap; the explore/exploit tradeoff tells us when to try new things and when to stick with what we know and love; caching tells us how to manage our space; scheduling theory tells us how to manage our time.
Q4. What are the similarities between the workings of computers and the human mind?
Brian Christian: First I’ll turn that question on its head and highlight one of the biggest differences.
To paraphrase the UNM’s Dave Ackley, the imperative of a computer program is “the precisely correct answer, as prompt as possible,” whereas the imperative of animal cognition (including our own) is the reverse: “a prompt response, as correct as possible.”
As computer scientists explore systems with real-time constraints, and problems sufficiently difficult that grinding out the exact solution (no matter how long it takes) simply doesn’t make sense, we are starting to see that distinction begin to narrow.
Q5. Our lives are constrained by limited space and time, limits that give rise to a particular set of problems. Do computers, too, face the same constraints?
Brian Christian: Computers of course have space constraints — there are limits to how much data can be kept in the caches or the RAM, for instance, which gives rise to caching algorithms. These, in turn, offer us ways of thinking about how we manage the limited space in our own lives (in the book we compare some of Martha Stewart’s edicts about home organization to some of the canonical results in caching theory to see which hold water and which don’t).
Many systems, too, operate under time constraints, which offers us a whole other set of insights we can draw from.
For instance, algorithms for high-frequency trading must determine in a matter of microseconds whether to take an offer or to let it go by — do you hold out for a better price, risking that you may never get as good of a deal ever again?
Many human decisions take this form, across a wide range of domains. This type of “optimal stopping” structure underlies everything from buying and selling houses to our romantic lives. Modern operating systems also include what’s known as a “scheduler,” which determines the best way to make use of the CPU’s limited time. There have been a number of high-profile cases of scheduling failures, including the 1997 Mars Pathfinder mission, where the lander made it all the way to the Martian surface successfully, but then appeared to start procrastinating once it got there: whiling away on low-priority tasks while critical work languished. Studying these failures and the methods for avoiding them can in turn give us strategies for making the most of our own limited time.
Q6. Can computer algorithms help us to have better hunches?
Brian Christian: I think so. For instance, we have a chapter on inductive reasoning that focuses on Bayesian inference. There are some lovely rules of thumb that come out of that. For instance, if you need to predict how long something will last — whether it’s how long a romantic relationship will continue, how long a company will exist, or simply how long it will be before the next bus pulls up — the best you can do, absent any familiarity with the domain, is to assume you’re exactly halfway through, and so it will last exactly as long into the future as it’s lasted already. More broadly, one of the upshots of developing an understanding of Bayesian inference is that if you have experience in a domain, your hunches are likely to be quite good. That’s intuitive enough, but the problem comes when your experiences are not a representative sample of reality.
In the modern world, you can get situations where gun violence in reality is in decline, yet the representation of gun violence in the news is going up. For this reason, it’s probably harder to be a good Bayesian than it’s ever been.
Q7. What will happen if AI system becomes better than humans at most or all cognitive tasks?
Brian Christian: That’s a huge question, and the subject in part of my next book. I think a fundamental restructuring of society is likely to happen — and may be necessary. That’s likely to be a bumpy ride, but it will raise critical and important questions.
And I do think that one of the fascinating outcomes of the progress of AI is that it gives us a new opportunity and new means of understanding the nature of human intelligence — a chance to better know ourselves. That’s a powerful thing, and a good thing.
——————-
Brian Christian is the author of The Most Human Human, a Wall Street Journal bestseller, New York Times editors’ choice, and New Yorker favorite book of the year. His writing has appeared in The New Yorker, The Atlantic, Wired, The Wall Street Journal, The Guardian and The Paris Review, as well as scientific journals such as Cognitive Science, and has been translated into eleven languages. He lives in San Francisco.
Resources
Related Posts
– Wrestling Knowledge into Computable Intelligence. By Michael K. Bergman. ODBMS.org NOVEMBER 17, 2016
– Machines of Loving Grace. Interview with John Markoff. ODBMS Industry Watch, August 11, 2016
Follow us on Twitter: @odbmsorg
##